

The Rise of the Rest:
EM ETFs Positioned for Global Outperformance
It is a fascinating shift in the global economic landscape. As of 2026, the “centre of gravity” for critical technology and finance has moved decisively toward emerging economies. The world’s largest electric vehicle (EV) maker & battery supplier, the fastest growing digital bank, the biggest semiconductor manufacturer and the biggest memory chip manufacturer are all based emerging markets.
This concentration of power represents a “New World Order” in manufacturing. In the 20th century, the West designed and built the world. In 2026, the West often designs the software, but the physical reality of the modern world – the chips, the cars, and the digital wallets – is largely built and scaled in the East and South.
Emerging markets can be rewarding but navigating them through individual stocks or active managers is challenging and often expensive. ETFs solve this problem elegantly. They package entire markets, across dozens of countries and thousands of companies into a single, liquid, low‑cost instrument. Investors get broad diversification, precise index exposure, tight bid‑ask spreads, and no manager selection risk. This combination makes ETFs the most practical and cost‑effective way to capture the long‑term growth potential of emerging economies.
For broad EM exposure, two of the largest, most liquid, and lowest-cost options stand out: iShares Core MSCI Emerging Markets ETF (IEMG) and Vanguard FTSE Emerging Markets ETF (VWO).
iShares Core MSCI Emerging Markets ETF (IEMG) is currently the largest emerging market ETF in the world with over USD 140 billion assets under management. It tracks the MSCI Emerging Markets Investable Market Index and provides comprehensive broad emerging market coverage, including between 2,600-2,800 large-, mid- and small-cap stocks. Its expense ratio sits at 0,09%.
Vanguard FTSE Emerging Markets ETF (VWO) is the second largest emerging market ETF and tracks the FTSE Emerging Markets All Cap China A Inclusion Index. It is a cost leader in this space with an expense ratio of 0,07% and provides deep diversification with roughly 6,000 holdings.
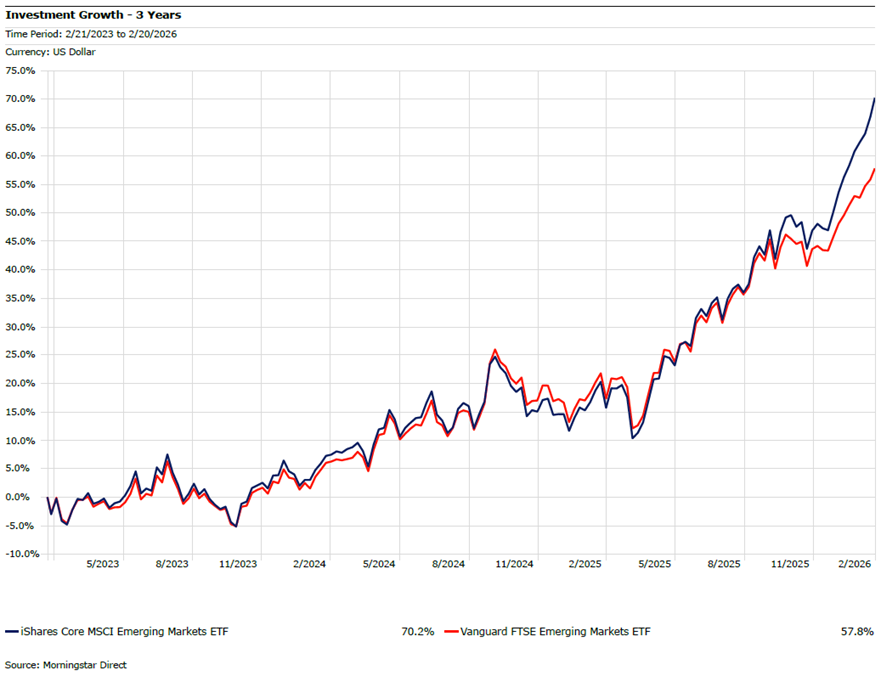
Key differences:
- Benchmarks: VWO benchmark includes select A Class share usually restricted to domestic investors. The greatest structural difference is the classification of emerging markets. Most notably VWO’s FTSE benchmark classifies South Korea as a developed market. MSCI classifies South Korea as developing and so it is included in IEMG and carries a significant allocation. Importantly, this market has been a top performer during recent history due to its tech, AI and semiconductor related stocks.
- Number of holdings: IEMG is more concentrated in larger more liquid names with between 2,600 & 2,800 holdings. VWO offers greater diversification, including more small-cap stocks, with roughly 6,000 holdings.
- Expense ratios: VWO has a slightly lower expense ratio of 0,07% vs IEMGs 0,09%.
- Geographic & Sector weightings: Both have heavy exposures to China, Taiwan and India with similar sectors mixes, however with the inclusion of South Korea, IEMG has a lower allocation toward China and greater tech exposure. VWO has a larger tilt toward China and a greater inclusion of small-caps.
Vanguard FTSE Emerging Markets – Country Allocation

iShares MSCI Emerging Markets – Country Allocation

What if you are looking for more targeted exposure?
If you’re seeking concentrated bets on high-conviction EM countries – especially after 2025’s standout performers (led by AI/semiconductor tailwinds in Asia and commodity rebounds elsewhere) – consider these single-country or ex-China options. These attracted strong interest, inflows, and/or performance in 2025, with positive analyst sentiment carrying into 2026.
- iShares MSCI Emerging Markets ex China ETF (EMXC): Tracks the MSCI Emerging Markets ex China Index for large- and mid-cap exposure to emerging markets equities, excluding China (heavy in Taiwan, India, South Korea for diversified EM without China risk). Expense Ratio: 0.25%; Liquidity: High
- iShares MSCI South Korea ETF (EWY): Tracks the MSCI Korea 25/50 Index for concentrated exposure to large- and mid-cap South Korean companies. South Korea was an EM leader in 2025 due to its heavy tech weighting, including chip giants like Samsung & SK Hynix. Expense Ratio: 0.59%; Liquidity: High
- iShares MSCI Taiwan ETF (EWT): Tracks the MSCI Taiwan 25/50 Index for large- and mid-cap Taiwanese equities (dominated by semiconductors, e.g. TSMC). Expense Ratio: 0.59%; Liquidity: High
- iShares MSCI Brazil ETF (EWZ): Tracks the MSCI Brazil 25/50 Index for large- and mid-cap Brazilian equities (commodity/financials focus). Brazil benefitted greatly from commodity tailwinds in 2025. Expense Ratio: 0.59%; Liquidity: Excellent
- iShares MSCI South Africa (EZA): Tracks the MSCI South Africa 25/50 Index for large- and mid-cap South African equities (materials, financials, precious metals influence). South Africa benefitted greatly from commodity tailwinds in 2025. Expense Ratio: 0.59%; Liquidity: Moderate
- iShares MSCI India ETF (INDA): Tracks the MSCI India Index for large- and mid-cap Indian equities (broad growth exposure to financials, tech, consumer sectors). Expense Ratio: 0.61%; Liquidity: High

Whether opting for broad, diversified EM exposure or targeted country plays, understanding these nuances—index methodology, geographic tilts, costs, and factor drivers—is crucial for aligning with your goals and risk tolerance. We’re here to guide you through the details and help tailor the right fit.
With the diverse ETF universe, it is important to note that each investor may have a different requirement and as such the above Insight does not constitute financial advice. It is important to consider individual needs and speak to your financial advisor where appropriate.